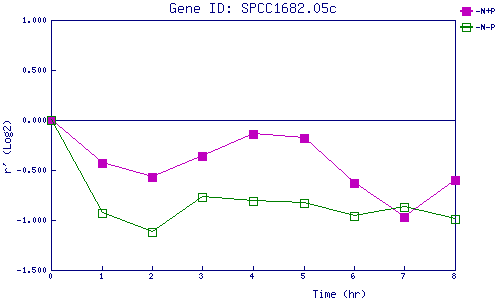
| 0 | 1 | 2 | 3 | 4 | 5 | 6 | 7 | 8 | |
| -N+P | 0.000 | -0.426 | -0.568 | -0.361 | -0.140 | -0.180 | -0.630 | -0.968 | -0.602 |
| -N-P | 0.000 | -0.926 | -1.124 | -0.771 | -0.813 | -0.833 | -0.957 | -0.870 | -0.993 |
|
-N+P: Nitrogen starved in the presence of P-factor -N-P: Nitrogen starved in the absence of P-factor |