tfh47 ssl1
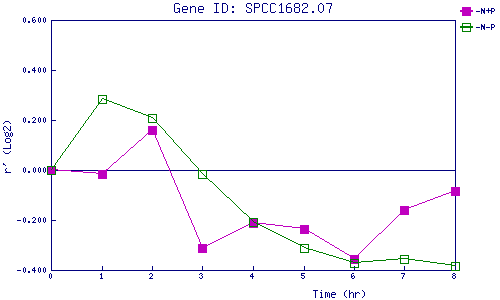
| 0 | 1 | 2 | 3 | 4 | 5 | 6 | 7 | 8 | |
| -N+P | 0.000 | -0.015 | 0.160 | -0.312 | -0.211 | -0.236 | -0.357 | -0.162 | -0.085 |
| -N-P | 0.000 | 0.284 | 0.210 | -0.017 | -0.208 | -0.314 | -0.371 | -0.357 | -0.385 |
|
-N+P: Nitrogen starved in the presence of P-factor -N-P: Nitrogen starved in the absence of P-factor |