rpn8
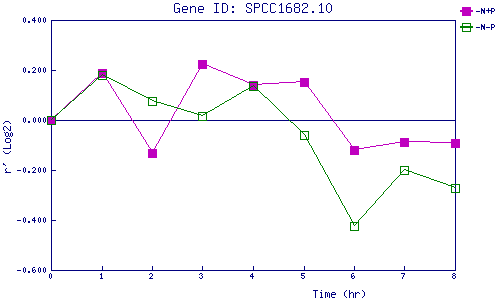
| 0 | 1 | 2 | 3 | 4 | 5 | 6 | 7 | 8 | |
| -N+P | 0.000 | 0.189 | -0.131 | 0.224 | 0.141 | 0.152 | -0.122 | -0.090 | -0.092 |
| -N-P | 0.000 | 0.179 | 0.075 | 0.018 | 0.138 | -0.060 | -0.424 | -0.200 | -0.274 |
|
-N+P: Nitrogen starved in the presence of P-factor -N-P: Nitrogen starved in the absence of P-factor |