reserved_name_ubp16
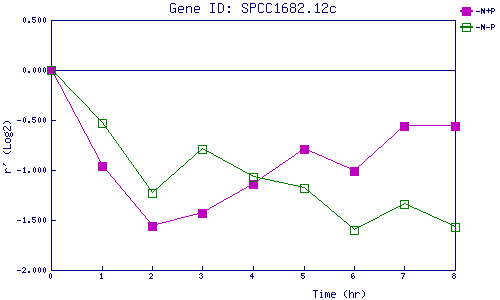
| 0 | 1 | 2 | 3 | 4 | 5 | 6 | 7 | 8 | |
| -N+P | 0.000 | -0.955 | -1.559 | -1.429 | -1.143 | -0.793 | -1.014 | -0.564 | -0.560 |
| -N-P | 0.000 | -0.529 | -1.235 | -0.791 | -1.073 | -1.184 | -1.605 | -1.342 | -1.574 |
|
-N+P: Nitrogen starved in the presence of P-factor -N-P: Nitrogen starved in the absence of P-factor |