| 0 | 1 | 2 | 3 | 4 | 5 | 6 | 7 | 8 | |
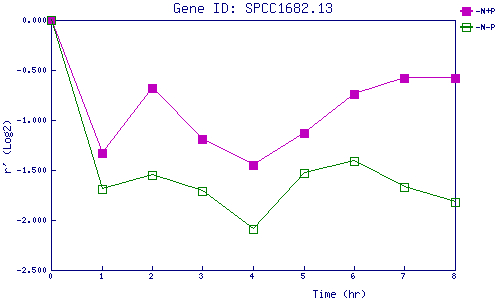
| -N+P | 0.000 | -1.334 | -0.684 | -1.194 | -1.454 | -1.128 | -0.743 | -0.582 | -0.575 |
| -N-P | 0.000 | -1.689 | -1.551 | -1.709 | -2.090 | -1.531 | -1.409 | -1.674 | -1.816 |
|
-N+P: Nitrogen starved in the presence of P-factor -N-P: Nitrogen starved in the absence of P-factor |