rpl19-2 rpl1902
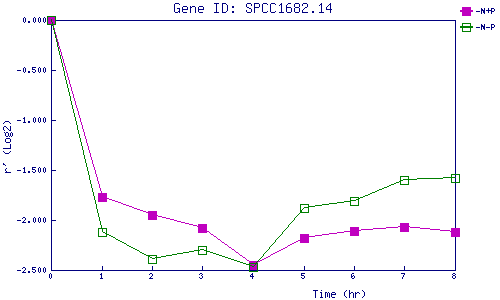
| 0 | 1 | 2 | 3 | 4 | 5 | 6 | 7 | 8 | |
| -N+P | 0.000 | -1.766 | -1.949 | -2.085 | -2.446 | -2.180 | -2.112 | -2.067 | -2.119 |
| -N-P | 0.000 | -2.124 | -2.387 | -2.296 | -2.469 | -1.879 | -1.810 | -1.600 | -1.584 |
|
-N+P: Nitrogen starved in the presence of P-factor -N-P: Nitrogen starved in the absence of P-factor |