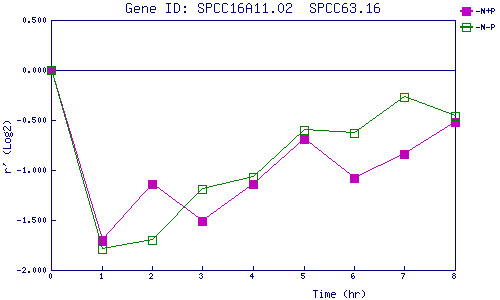
| 0 | 1 | 2 | 3 | 4 | 5 | 6 | 7 | 8 | |
| -N+P | 0.000 | -1.705 | -1.144 | -1.509 | -1.136 | -0.693 | -1.077 | -0.839 | -0.524 |
| -N-P | 0.000 | -1.792 | -1.697 | -1.193 | -1.072 | -0.600 | -0.628 | -0.270 | -0.464 |
|
-N+P: Nitrogen starved in the presence of P-factor -N-P: Nitrogen starved in the absence of P-factor |