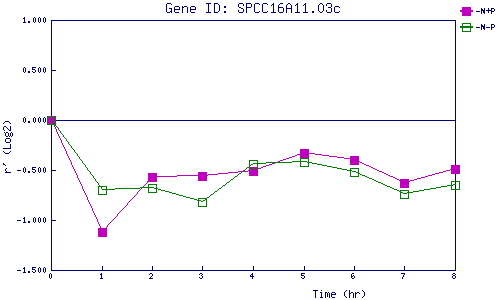
| 0 | 1 | 2 | 3 | 4 | 5 | 6 | 7 | 8 | |
| -N+P | 0.000 | -1.123 | -0.568 | -0.563 | -0.513 | -0.331 | -0.398 | -0.627 | -0.486 |
| -N-P | 0.000 | -0.700 | -0.678 | -0.820 | -0.439 | -0.420 | -0.518 | -0.741 | -0.646 |
|
-N+P: Nitrogen starved in the presence of P-factor -N-P: Nitrogen starved in the absence of P-factor |