dim1
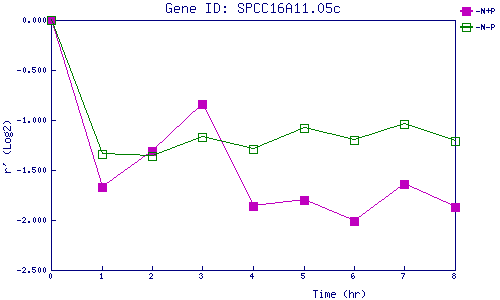
| 0 | 1 | 2 | 3 | 4 | 5 | 6 | 7 | 8 | |
| -N+P | 0.000 | -1.669 | -1.308 | -0.835 | -1.865 | -1.800 | -2.010 | -1.642 | -1.871 |
| -N-P | 0.000 | -1.343 | -1.359 | -1.169 | -1.292 | -1.079 | -1.203 | -1.045 | -1.214 |
|
-N+P: Nitrogen starved in the presence of P-factor -N-P: Nitrogen starved in the absence of P-factor |