| 0 | 1 | 2 | 3 | 4 | 5 | 6 | 7 | 8 | |
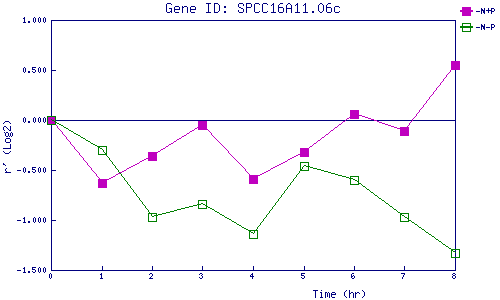
| -N+P | 0.000 | -0.627 | -0.365 | -0.054 | -0.588 | -0.318 | 0.058 | -0.108 | 0.550 |
| -N-P | 0.000 | -0.302 | -0.967 | -0.836 | -1.142 | -0.464 | -0.603 | -0.967 | -1.327 |
|
-N+P: Nitrogen starved in the presence of P-factor -N-P: Nitrogen starved in the absence of P-factor |
