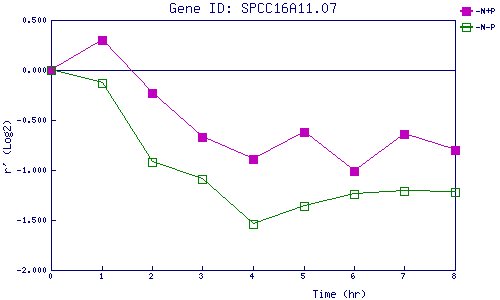
| 0 | 1 | 2 | 3 | 4 | 5 | 6 | 7 | 8 | |
| -N+P | 0.000 | 0.299 | -0.229 | -0.671 | -0.892 | -0.625 | -1.009 | -0.643 | -0.803 |
| -N-P | 0.000 | -0.134 | -0.916 | -1.093 | -1.542 | -1.357 | -1.244 | -1.210 | -1.216 |
|
-N+P: Nitrogen starved in the presence of P-factor -N-P: Nitrogen starved in the absence of P-factor |