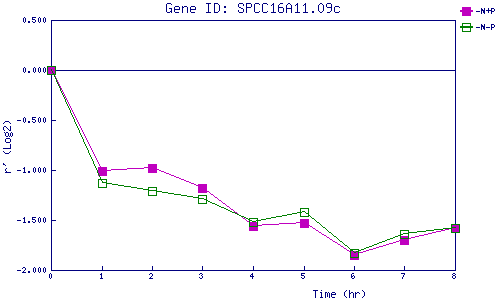
| 0 | 1 | 2 | 3 | 4 | 5 | 6 | 7 | 8 | |
| -N+P | 0.000 | -1.006 | -0.980 | -1.177 | -1.565 | -1.534 | -1.846 | -1.702 | -1.581 |
| -N-P | 0.000 | -1.129 | -1.206 | -1.292 | -1.521 | -1.417 | -1.828 | -1.641 | -1.580 |
|
-N+P: Nitrogen starved in the presence of P-factor -N-P: Nitrogen starved in the absence of P-factor |