oca8
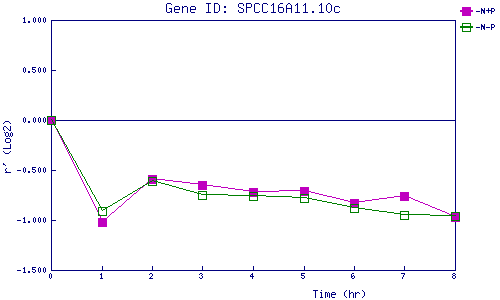
| 0 | 1 | 2 | 3 | 4 | 5 | 6 | 7 | 8 | |
| -N+P | 0.000 | -1.022 | -0.587 | -0.652 | -0.715 | -0.706 | -0.832 | -0.761 | -0.970 |
| -N-P | 0.000 | -0.913 | -0.607 | -0.748 | -0.764 | -0.780 | -0.883 | -0.946 | -0.959 |
|
-N+P: Nitrogen starved in the presence of P-factor -N-P: Nitrogen starved in the absence of P-factor |