reserved_name_ubp1
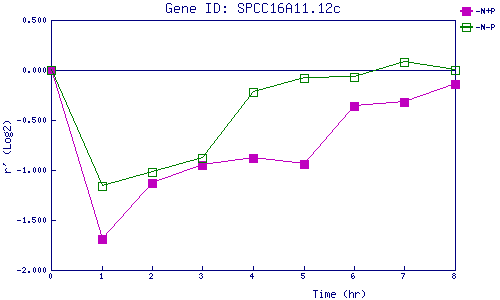
| 0 | 1 | 2 | 3 | 4 | 5 | 6 | 7 | 8 | |
| -N+P | 0.000 | -1.695 | -1.127 | -0.951 | -0.881 | -0.941 | -0.356 | -0.325 | -0.137 |
| -N-P | 0.000 | -1.157 | -1.020 | -0.884 | -0.218 | -0.077 | -0.074 | 0.076 | 0.005 |
|
-N+P: Nitrogen starved in the presence of P-factor -N-P: Nitrogen starved in the absence of P-factor |