| 0 | 1 | 2 | 3 | 4 | 5 | 6 | 7 | 8 | |
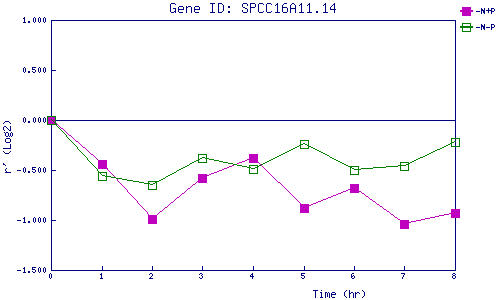
| -N+P | 0.000 | -0.440 | -0.990 | -0.576 | -0.375 | -0.877 | -0.681 | -1.038 | -0.933 |
| -N-P | 0.000 | -0.555 | -0.649 | -0.378 | -0.492 | -0.241 | -0.499 | -0.457 | -0.224 |
|
-N+P: Nitrogen starved in the presence of P-factor -N-P: Nitrogen starved in the absence of P-factor |