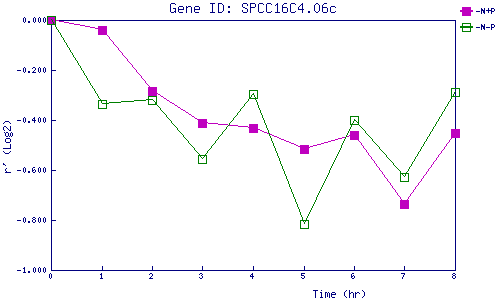
| 0 | 1 | 2 | 3 | 4 | 5 | 6 | 7 | 8 | |
| -N+P | 0.000 | -0.038 | -0.285 | -0.413 | -0.432 | -0.515 | -0.460 | -0.738 | -0.451 |
| -N-P | 0.000 | -0.334 | -0.319 | -0.555 | -0.298 | -0.817 | -0.399 | -0.627 | -0.289 |
|
-N+P: Nitrogen starved in the presence of P-factor -N-P: Nitrogen starved in the absence of P-factor |