skb15
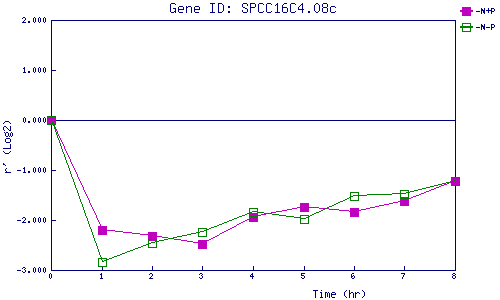
| 0 | 1 | 2 | 3 | 4 | 5 | 6 | 7 | 8 | |
| -N+P | 0.000 | -2.198 | -2.327 | -2.480 | -1.939 | -1.738 | -1.840 | -1.622 | -1.220 |
| -N-P | 0.000 | -2.845 | -2.458 | -2.233 | -1.848 | -1.983 | -1.514 | -1.489 | -1.224 |
|
-N+P: Nitrogen starved in the presence of P-factor -N-P: Nitrogen starved in the absence of P-factor |