| 0 | 1 | 2 | 3 | 4 | 5 | 6 | 7 | 8 | |
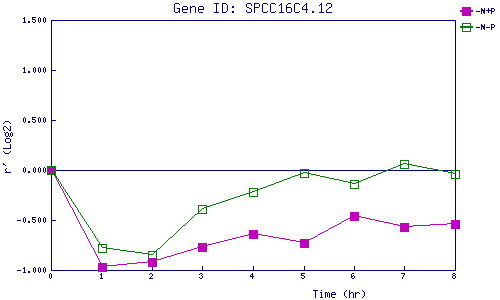
| -N+P | 0.000 | -0.971 | -0.920 | -0.773 | -0.645 | -0.732 | -0.455 | -0.569 | -0.539 |
| -N-P | 0.000 | -0.781 | -0.853 | -0.390 | -0.220 | -0.032 | -0.144 | 0.061 | -0.038 |
|
-N+P: Nitrogen starved in the presence of P-factor -N-P: Nitrogen starved in the absence of P-factor |
