sfc4
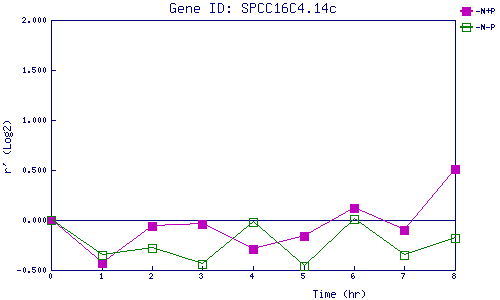
| 0 | 1 | 2 | 3 | 4 | 5 | 6 | 7 | 8 | |
| -N+P | 0.000 | -0.431 | -0.061 | -0.035 | -0.291 | -0.162 | 0.116 | -0.102 | 0.509 |
| -N-P | 0.000 | -0.348 | -0.276 | -0.438 | -0.023 | -0.457 | 0.010 | -0.346 | -0.179 |
|
-N+P: Nitrogen starved in the presence of P-factor -N-P: Nitrogen starved in the absence of P-factor |