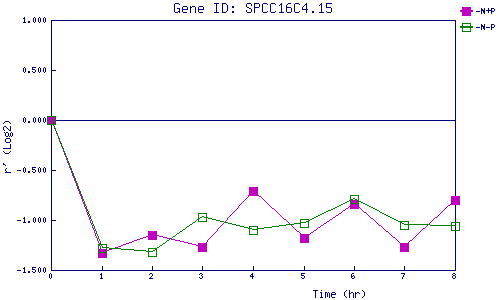
| 0 | 1 | 2 | 3 | 4 | 5 | 6 | 7 | 8 | |
| -N+P | 0.000 | -1.326 | -1.150 | -1.271 | -0.708 | -1.181 | -0.836 | -1.273 | -0.802 |
| -N-P | 0.000 | -1.275 | -1.322 | -0.971 | -1.096 | -1.029 | -0.792 | -1.052 | -1.055 |
|
-N+P: Nitrogen starved in the presence of P-factor -N-P: Nitrogen starved in the absence of P-factor |