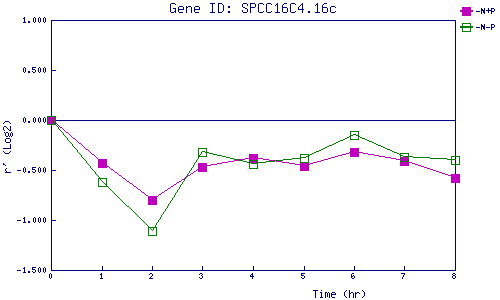
| 0 | 1 | 2 | 3 | 4 | 5 | 6 | 7 | 8 | |
| -N+P | 0.000 | -0.431 | -0.795 | -0.466 | -0.376 | -0.458 | -0.318 | -0.414 | -0.575 |
| -N-P | 0.000 | -0.623 | -1.113 | -0.321 | -0.437 | -0.375 | -0.153 | -0.371 | -0.398 |
|
-N+P: Nitrogen starved in the presence of P-factor -N-P: Nitrogen starved in the absence of P-factor |
