taf50
| 0 | 1 | 2 | 3 | 4 | 5 | 6 | 7 | 8 | |
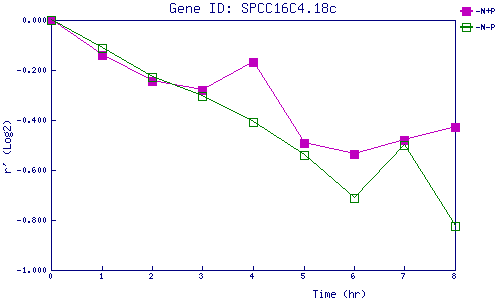
| -N+P | 0.000 | -0.141 | -0.243 | -0.279 | -0.167 | -0.492 | -0.535 | -0.480 | -0.427 |
| -N-P | 0.000 | -0.111 | -0.227 | -0.303 | -0.409 | -0.539 | -0.713 | -0.501 | -0.823 |
|
-N+P: Nitrogen starved in the presence of P-factor -N-P: Nitrogen starved in the absence of P-factor |
