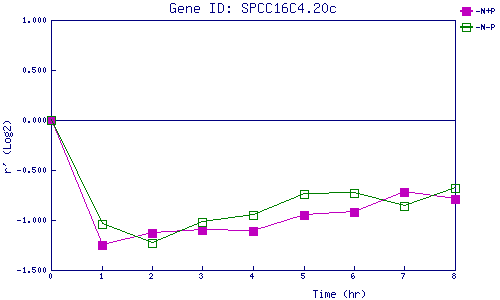
| 0 | 1 | 2 | 3 | 4 | 5 | 6 | 7 | 8 | |
| -N+P | 0.000 | -1.247 | -1.131 | -1.101 | -1.111 | -0.954 | -0.919 | -0.715 | -0.789 |
| -N-P | 0.000 | -1.043 | -1.235 | -1.024 | -0.950 | -0.743 | -0.726 | -0.859 | -0.684 |
|
-N+P: Nitrogen starved in the presence of P-factor -N-P: Nitrogen starved in the absence of P-factor |