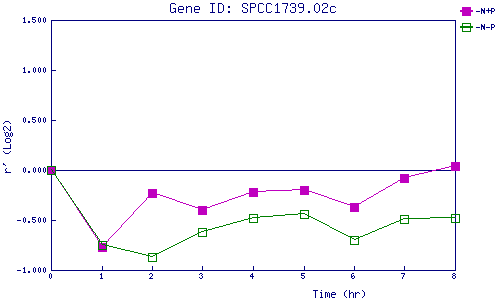
| 0 | 1 | 2 | 3 | 4 | 5 | 6 | 7 | 8 | |
| -N+P | 0.000 | -0.770 | -0.234 | -0.402 | -0.225 | -0.202 | -0.373 | -0.077 | 0.035 |
| -N-P | 0.000 | -0.751 | -0.867 | -0.624 | -0.479 | -0.440 | -0.700 | -0.487 | -0.479 |
|
-N+P: Nitrogen starved in the presence of P-factor -N-P: Nitrogen starved in the absence of P-factor |