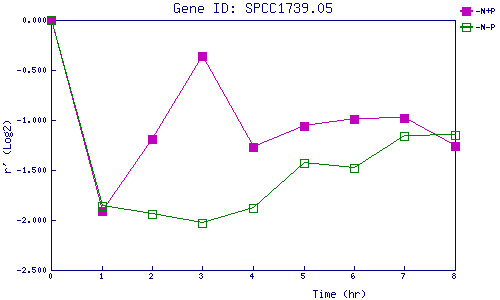
| 0 | 1 | 2 | 3 | 4 | 5 | 6 | 7 | 8 | |
| -N+P | 0.000 | -1.908 | -1.189 | -0.365 | -1.270 | -1.057 | -0.991 | -0.983 | -1.265 |
| -N-P | 0.000 | -1.863 | -1.942 | -2.032 | -1.875 | -1.428 | -1.478 | -1.157 | -1.148 |
|
-N+P: Nitrogen starved in the presence of P-factor -N-P: Nitrogen starved in the absence of P-factor |