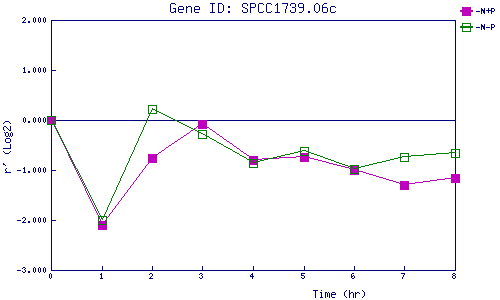
| 0 | 1 | 2 | 3 | 4 | 5 | 6 | 7 | 8 | |
| -N+P | 0.000 | -2.094 | -0.764 | -0.090 | -0.799 | -0.745 | -0.996 | -1.293 | -1.159 |
| -N-P | 0.000 | -1.998 | 0.217 | -0.270 | -0.867 | -0.613 | -0.977 | -0.737 | -0.663 |
|
-N+P: Nitrogen starved in the presence of P-factor -N-P: Nitrogen starved in the absence of P-factor |