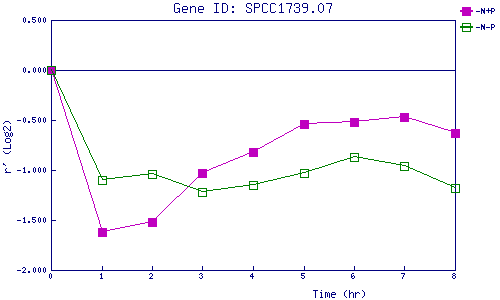
| 0 | 1 | 2 | 3 | 4 | 5 | 6 | 7 | 8 | |
| -N+P | 0.000 | -1.623 | -1.515 | -1.027 | -0.817 | -0.544 | -0.521 | -0.468 | -0.628 |
| -N-P | 0.000 | -1.102 | -1.044 | -1.223 | -1.148 | -1.026 | -0.867 | -0.956 | -1.176 |
|
-N+P: Nitrogen starved in the presence of P-factor -N-P: Nitrogen starved in the absence of P-factor |