ppe1 esp1 ppx1
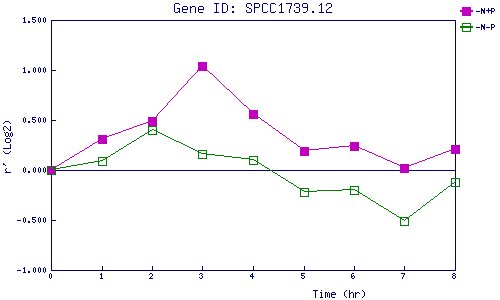
| 0 | 1 | 2 | 3 | 4 | 5 | 6 | 7 | 8 | |
| -N+P | 0.000 | 0.306 | 0.493 | 1.039 | 0.559 | 0.186 | 0.245 | 0.023 | 0.211 |
| -N-P | 0.000 | 0.093 | 0.396 | 0.163 | 0.100 | -0.222 | -0.204 | -0.507 | -0.118 |
|
-N+P: Nitrogen starved in the presence of P-factor -N-P: Nitrogen starved in the absence of P-factor |