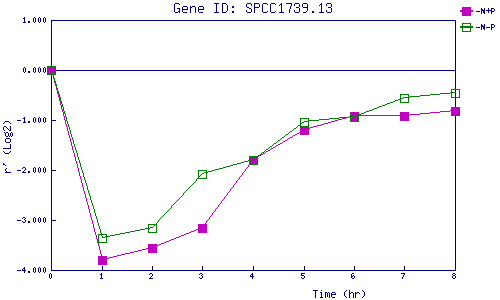
| 0 | 1 | 2 | 3 | 4 | 5 | 6 | 7 | 8 | |
| -N+P | 0.000 | -3.794 | -3.564 | -3.150 | -1.790 | -1.194 | -0.918 | -0.921 | -0.819 |
| -N-P | 0.000 | -3.361 | -3.168 | -2.086 | -1.800 | -1.046 | -0.931 | -0.563 | -0.461 |
|
-N+P: Nitrogen starved in the presence of P-factor -N-P: Nitrogen starved in the absence of P-factor |