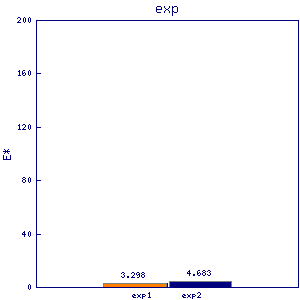
npp106
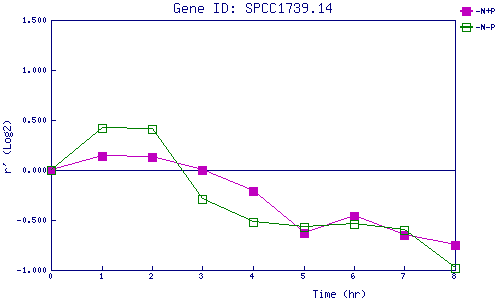
| 0 | 1 | 2 | 3 | 4 | 5 | 6 | 7 | 8 | |
| -N+P | 0.000 | 0.137 | 0.130 | -0.002 | -0.212 | -0.629 | -0.459 | -0.646 | -0.752 |
| -N-P | 0.000 | 0.420 | 0.409 | -0.288 | -0.519 | -0.574 | -0.535 | -0.603 | -0.985 |
|
-N+P: Nitrogen starved in the presence of P-factor -N-P: Nitrogen starved in the absence of P-factor |