ssb2
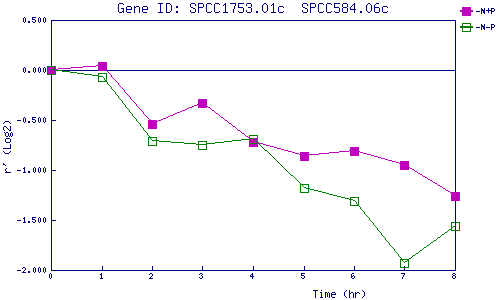
| 0 | 1 | 2 | 3 | 4 | 5 | 6 | 7 | 8 | |
| -N+P | 0.000 | 0.040 | -0.542 | -0.332 | -0.716 | -0.865 | -0.806 | -0.954 | -1.259 |
| -N-P | 0.000 | -0.067 | -0.712 | -0.752 | -0.692 | -1.176 | -1.314 | -1.934 | -1.562 |
|
-N+P: Nitrogen starved in the presence of P-factor -N-P: Nitrogen starved in the absence of P-factor |