git3
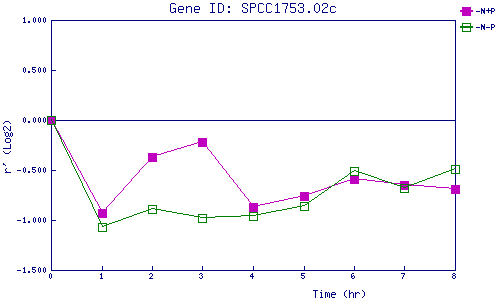
| 0 | 1 | 2 | 3 | 4 | 5 | 6 | 7 | 8 | |
| -N+P | 0.000 | -0.934 | -0.367 | -0.215 | -0.871 | -0.758 | -0.589 | -0.649 | -0.686 |
| -N-P | 0.000 | -1.067 | -0.893 | -0.982 | -0.957 | -0.864 | -0.514 | -0.683 | -0.490 |
|
-N+P: Nitrogen starved in the presence of P-factor -N-P: Nitrogen starved in the absence of P-factor |