tol1
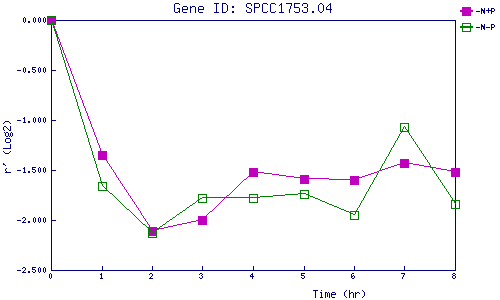
| 0 | 1 | 2 | 3 | 4 | 5 | 6 | 7 | 8 | |
| -N+P | 0.000 | -1.350 | -2.111 | -2.003 | -1.518 | -1.593 | -1.596 | -1.431 | -1.522 |
| -N-P | 0.000 | -1.665 | -2.133 | -1.780 | -1.784 | -1.736 | -1.946 | -1.068 | -1.841 |
|
-N+P: Nitrogen starved in the presence of P-factor -N-P: Nitrogen starved in the absence of P-factor |