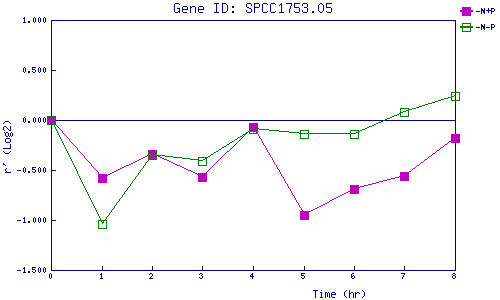
| 0 | 1 | 2 | 3 | 4 | 5 | 6 | 7 | 8 | |
| -N+P | 0.000 | -0.584 | -0.342 | -0.566 | -0.072 | -0.954 | -0.693 | -0.560 | -0.179 |
| -N-P | 0.000 | -1.045 | -0.354 | -0.412 | -0.090 | -0.138 | -0.144 | 0.083 | 0.244 |
|
-N+P: Nitrogen starved in the presence of P-factor -N-P: Nitrogen starved in the absence of P-factor |