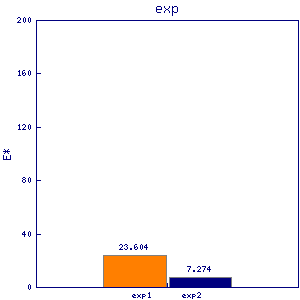
gms1
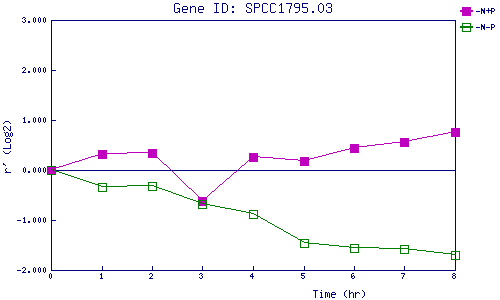
| 0 | 1 | 2 | 3 | 4 | 5 | 6 | 7 | 8 | |
| -N+P | 0.000 | 0.312 | 0.347 | -0.624 | 0.269 | 0.184 | 0.431 | 0.570 | 0.763 |
| -N-P | 0.000 | -0.347 | -0.329 | -0.680 | -0.883 | -1.452 | -1.554 | -1.580 | -1.700 |
|
-N+P: Nitrogen starved in the presence of P-factor -N-P: Nitrogen starved in the absence of P-factor |