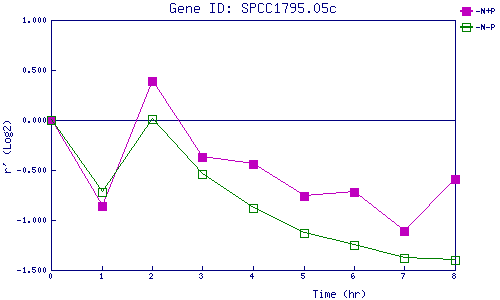
| 0 | 1 | 2 | 3 | 4 | 5 | 6 | 7 | 8 | |
| -N+P | 0.000 | -0.855 | 0.392 | -0.372 | -0.438 | -0.764 | -0.715 | -1.110 | -0.586 |
| -N-P | 0.000 | -0.720 | 0.011 | -0.544 | -0.881 | -1.132 | -1.249 | -1.376 | -1.397 |
|
-N+P: Nitrogen starved in the presence of P-factor -N-P: Nitrogen starved in the absence of P-factor |