sum3 ded1 slh3 moc2
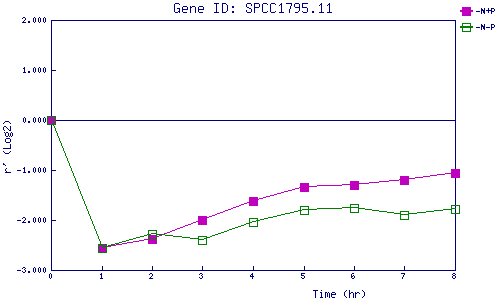
| 0 | 1 | 2 | 3 | 4 | 5 | 6 | 7 | 8 | |
| -N+P | 0.000 | -2.555 | -2.382 | -2.004 | -1.629 | -1.333 | -1.297 | -1.206 | -1.053 |
| -N-P | 0.000 | -2.567 | -2.280 | -2.393 | -2.045 | -1.803 | -1.754 | -1.897 | -1.772 |
|
-N+P: Nitrogen starved in the presence of P-factor -N-P: Nitrogen starved in the absence of P-factor |