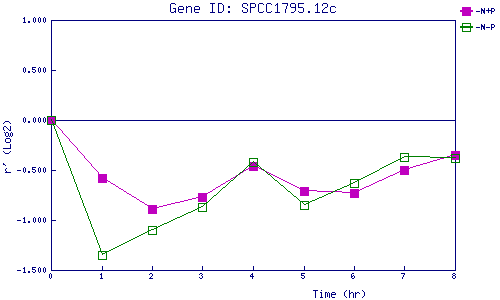
| 0 | 1 | 2 | 3 | 4 | 5 | 6 | 7 | 8 | |
| -N+P | 0.000 | -0.577 | -0.890 | -0.767 | -0.457 | -0.711 | -0.731 | -0.503 | -0.346 |
| -N-P | 0.000 | -1.348 | -1.102 | -0.869 | -0.415 | -0.854 | -0.630 | -0.368 | -0.380 |
|
-N+P: Nitrogen starved in the presence of P-factor -N-P: Nitrogen starved in the absence of P-factor |