| 0 | 1 | 2 | 3 | 4 | 5 | 6 | 7 | 8 | |
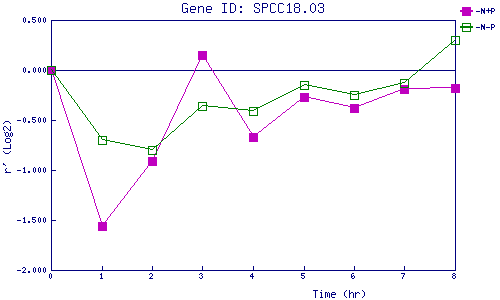
| -N+P | 0.000 | -1.559 | -0.910 | 0.149 | -0.666 | -0.273 | -0.382 | -0.187 | -0.185 |
| -N-P | 0.000 | -0.700 | -0.798 | -0.363 | -0.408 | -0.147 | -0.246 | -0.126 | 0.302 |
|
-N+P: Nitrogen starved in the presence of P-factor -N-P: Nitrogen starved in the absence of P-factor |