pof6
| 0 | 1 | 2 | 3 | 4 | 5 | 6 | 7 | 8 | |
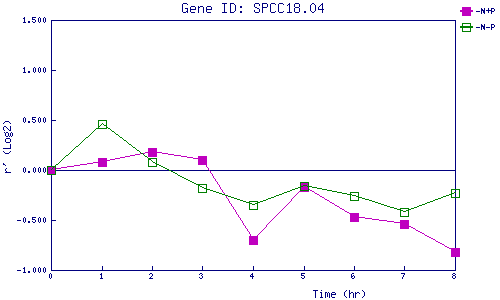
| -N+P | 0.000 | 0.080 | 0.175 | 0.099 | -0.698 | -0.173 | -0.471 | -0.535 | -0.820 |
| -N-P | 0.000 | 0.459 | 0.085 | -0.184 | -0.351 | -0.155 | -0.262 | -0.416 | -0.232 |
|
-N+P: Nitrogen starved in the presence of P-factor -N-P: Nitrogen starved in the absence of P-factor |
