| 0 | 1 | 2 | 3 | 4 | 5 | 6 | 7 | 8 | |
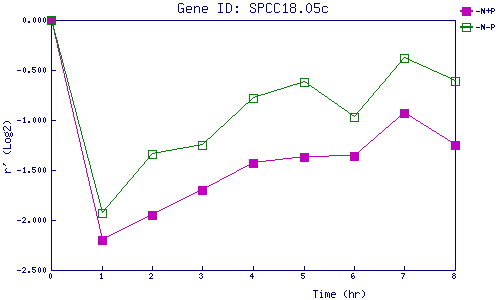
| -N+P | 0.000 | -2.201 | -1.952 | -1.702 | -1.429 | -1.372 | -1.357 | -0.933 | -1.248 |
| -N-P | 0.000 | -1.932 | -1.336 | -1.251 | -0.775 | -0.617 | -0.970 | -0.378 | -0.610 |
|
-N+P: Nitrogen starved in the presence of P-factor -N-P: Nitrogen starved in the absence of P-factor |