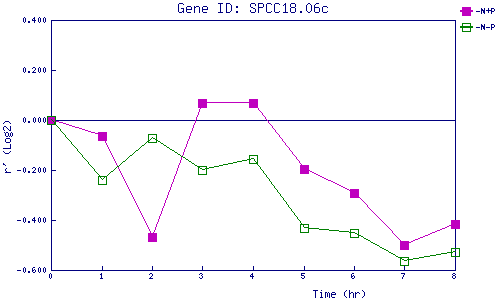
| 0 | 1 | 2 | 3 | 4 | 5 | 6 | 7 | 8 | |
| -N+P | 0.000 | -0.063 | -0.468 | 0.067 | 0.068 | -0.196 | -0.291 | -0.500 | -0.415 |
| -N-P | 0.000 | -0.241 | -0.072 | -0.202 | -0.155 | -0.432 | -0.451 | -0.563 | -0.529 |
|
-N+P: Nitrogen starved in the presence of P-factor -N-P: Nitrogen starved in the absence of P-factor |