rpc53
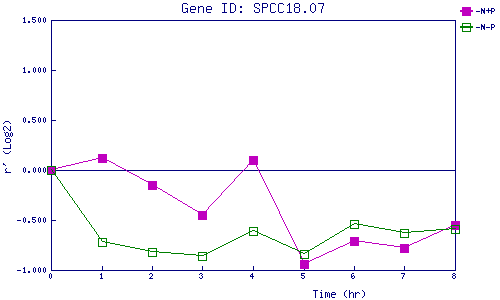
| 0 | 1 | 2 | 3 | 4 | 5 | 6 | 7 | 8 | |
| -N+P | 0.000 | 0.123 | -0.146 | -0.448 | 0.095 | -0.944 | -0.711 | -0.781 | -0.547 |
| -N-P | 0.000 | -0.722 | -0.819 | -0.859 | -0.610 | -0.838 | -0.542 | -0.633 | -0.591 |
|
-N+P: Nitrogen starved in the presence of P-factor -N-P: Nitrogen starved in the absence of P-factor |