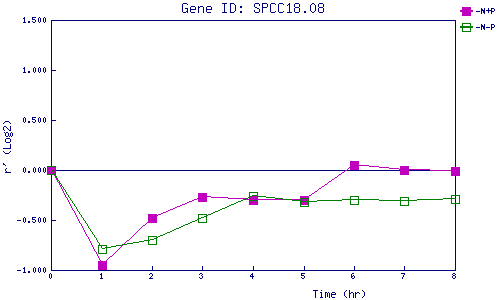
| 0 | 1 | 2 | 3 | 4 | 5 | 6 | 7 | 8 | |
| -N+P | 0.000 | -0.952 | -0.482 | -0.272 | -0.296 | -0.300 | 0.051 | 0.003 | -0.011 |
| -N-P | 0.000 | -0.790 | -0.699 | -0.480 | -0.258 | -0.323 | -0.298 | -0.307 | -0.287 |
|
-N+P: Nitrogen starved in the presence of P-factor -N-P: Nitrogen starved in the absence of P-factor |