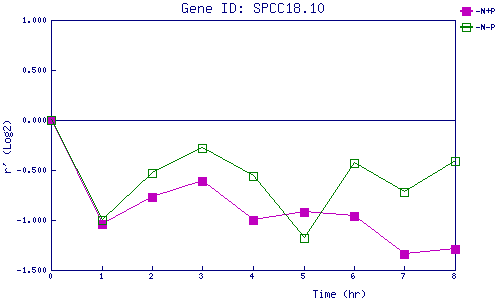
| 0 | 1 | 2 | 3 | 4 | 5 | 6 | 7 | 8 | |
| -N+P | 0.000 | -1.044 | -0.767 | -0.606 | -0.998 | -0.925 | -0.955 | -1.337 | -1.293 |
| -N-P | 0.000 | -1.001 | -0.532 | -0.281 | -0.556 | -1.177 | -0.432 | -0.715 | -0.408 |
|
-N+P: Nitrogen starved in the presence of P-factor -N-P: Nitrogen starved in the absence of P-factor |