sdc1
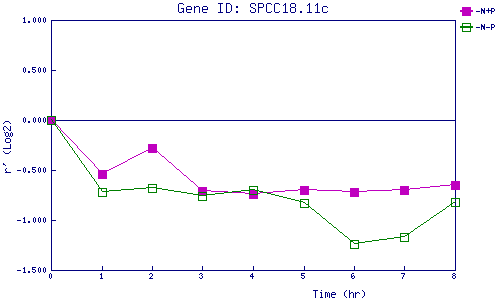
| 0 | 1 | 2 | 3 | 4 | 5 | 6 | 7 | 8 | |
| -N+P | 0.000 | -0.545 | -0.284 | -0.708 | -0.743 | -0.700 | -0.724 | -0.700 | -0.653 |
| -N-P | 0.000 | -0.720 | -0.680 | -0.755 | -0.696 | -0.831 | -1.239 | -1.174 | -0.821 |
|
-N+P: Nitrogen starved in the presence of P-factor -N-P: Nitrogen starved in the absence of P-factor |