| 0 | 1 | 2 | 3 | 4 | 5 | 6 | 7 | 8 | |
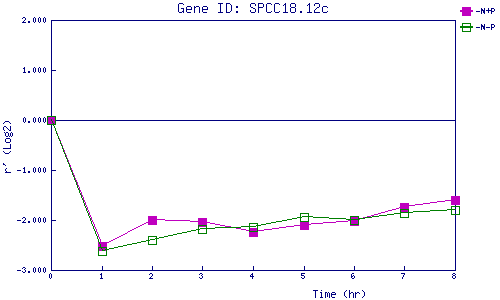
| -N+P | 0.000 | -2.527 | -1.995 | -2.041 | -2.235 | -2.101 | -2.012 | -1.749 | -1.600 |
| -N-P | 0.000 | -2.626 | -2.405 | -2.180 | -2.147 | -1.941 | -2.005 | -1.869 | -1.790 |
|
-N+P: Nitrogen starved in the presence of P-factor -N-P: Nitrogen starved in the absence of P-factor |