| 0 | 1 | 2 | 3 | 4 | 5 | 6 | 7 | 8 | |
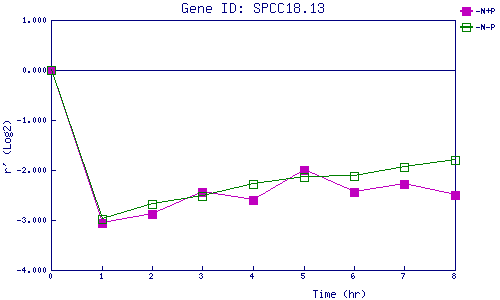
| -N+P | 0.000 | -3.059 | -2.877 | -2.432 | -2.603 | -2.010 | -2.443 | -2.279 | -2.500 |
| -N-P | 0.000 | -2.985 | -2.683 | -2.510 | -2.282 | -2.132 | -2.114 | -1.938 | -1.801 |
|
-N+P: Nitrogen starved in the presence of P-factor -N-P: Nitrogen starved in the absence of P-factor |