rpp0
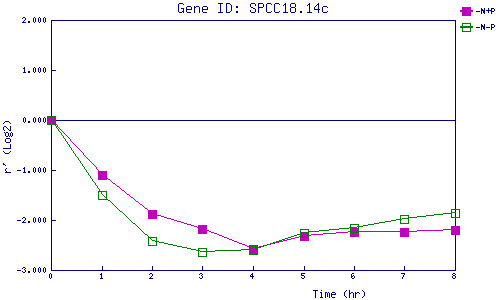
| 0 | 1 | 2 | 3 | 4 | 5 | 6 | 7 | 8 | |
| -N+P | 0.000 | -1.095 | -1.877 | -2.183 | -2.579 | -2.325 | -2.243 | -2.244 | -2.210 |
| -N-P | 0.000 | -1.496 | -2.429 | -2.648 | -2.610 | -2.259 | -2.168 | -1.986 | -1.854 |
|
-N+P: Nitrogen starved in the presence of P-factor -N-P: Nitrogen starved in the absence of P-factor |