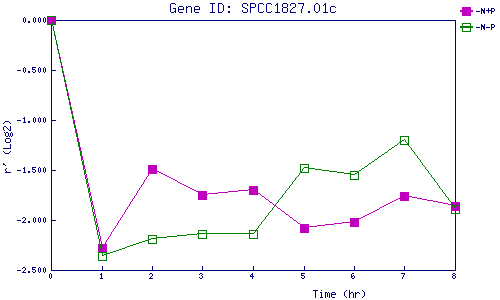
| 0 | 1 | 2 | 3 | 4 | 5 | 6 | 7 | 8 | |
| -N+P | 0.000 | -2.278 | -1.490 | -1.747 | -1.701 | -2.081 | -2.015 | -1.761 | -1.858 |
| -N-P | 0.000 | -2.360 | -2.188 | -2.144 | -2.138 | -1.475 | -1.550 | -1.201 | -1.888 |
|
-N+P: Nitrogen starved in the presence of P-factor -N-P: Nitrogen starved in the absence of P-factor |